

Tom Hicks | October 18, 2026
Editorial Note:
This is Part 3 of The Election Before the Election, our four-part Sunday investigation into the machinery that shapes American elections before voters ever reach the polls. Today, we’re looking at congressional boundaries, who draws them, and what happens when a community gets divided on a map.
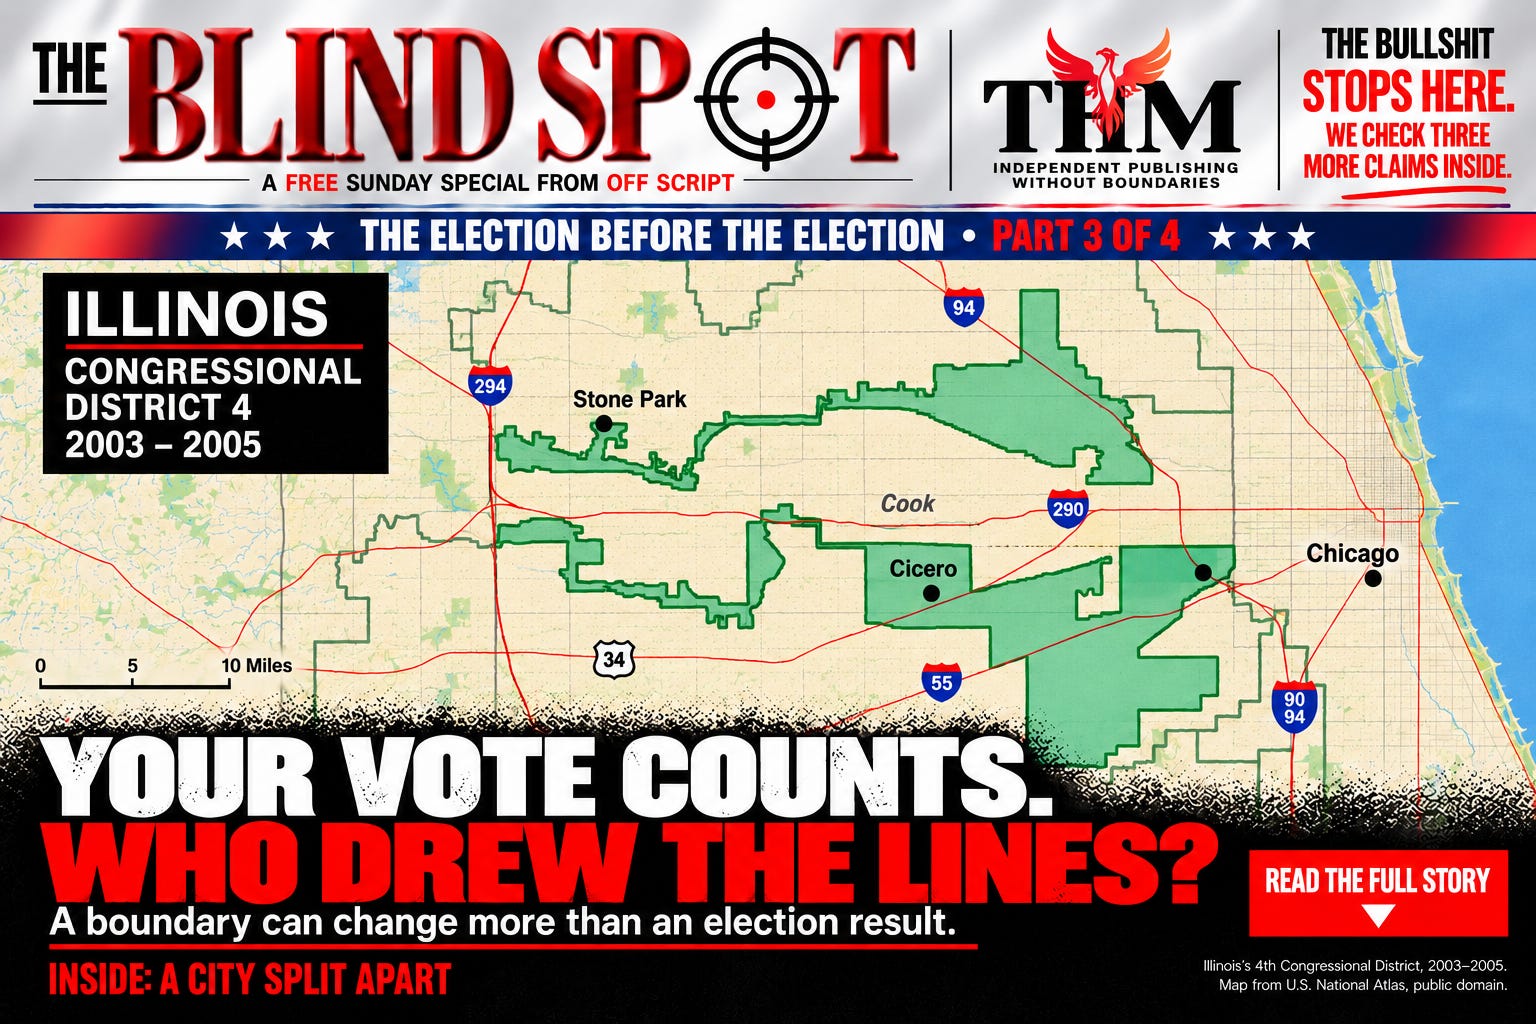
Imagine two Americans walking into their polling places on November 3.
Both are registered. Both receive legitimate ballots, mark their choices, and cast their votes for Congress. Nobody interferes with the process. Nobody tampers with their ballots. Everything is counted exactly as the law requires.
One of those Americans lives in a congressional district where either major party has a realistic opportunity to win. The other lives in a district where the same party has such an overwhelming advantage that changing the result would require a political earthquake.
Both votes count equally. But do those voters have comparable opportunities to change who represents them?
That’s a deceptively simple question, and I suspect most Americans don’t spend much time thinking about it. We’re accustomed to hearing that every vote matters, which is true in the sense that every eligible voter has the right to participate and every valid ballot must be counted. What we hear considerably less about is the machinery that determines which voters are grouped together in the first place.
That machinery can influence which communities have a representative who shares their priorities, how accessible that representative is, and how their concerns compete for attention. Sometimes the difference between two congressional districts is nothing more than a boundary running down the middle of a street, separating neighbors who share the same schools, roads, and local problems. Reuters investigation
And if you’re wondering whether this is just another abstract argument about election maps, let me take you to Tennessee.
A city divided. Memphis is a majority-Black city of roughly 630,000 residents. For decades, most of it was contained in Tennessee’s 9th Congressional District, which routinely elected Democrats. That arrangement gave much of the city a common congressional representative, although the district also included communities outside Memphis. Reuters
In 2026, Tennessee’s Republican-controlled legislature approved a new congressional map that divided Memphis among three districts, combining portions of the city with suburban and rural communities extending across the state. Tennessee congressional district maps
Supporters defended the map as a lawful exercise of the legislature’s redistricting authority. Critics argued that dividing a politically cohesive, majority-Black city would weaken its residents’ opportunity to elect candidates reflecting their preferences. Those are competing claims that require examining the actual boundaries, voting patterns, and legal standards rather than simply accepting either side’s description. Reuters
Reuters examined the changes in an October 17 investigation, looking beyond electoral arithmetic to constituent access, community representation, and federal spending. Its reporting offers a particularly useful reminder that congressional boundaries can affect everyday political relationships long after Election Day. Reuters investigation

Memphis, Tennessee. The city’s congressional representation has become a focal point of the state’s redistricting disputes.
Consider a city trying to secure federal assistance for transportation improvements, housing, or aging infrastructure. If that city is concentrated within one district, local officials may have a single principal congressional office with which to coordinate. Divide the city among several districts, and the same project may require conversations with multiple representatives whose constituencies extend far beyond the city.
That doesn’t automatically make the second arrangement worse. More representatives can sometimes mean more avenues for assistance. A member of Congress has a responsibility to every constituent, regardless of whether that person voted for them.
But the political incentives are different. A city’s voters may no longer represent a decisive share of any one district’s electorate, and the representative who once had a concentrated urban constituency may now answer to a very different combination of communities.
Nashville provides another example. Following Tennessee’s 2022 redistricting, the city was divided among three congressional districts, replacing a configuration in which much of Nashville had shared a single representative. Reuters
The political consequences were immediate: a Democratic-held Nashville-based seat was replaced by districts with substantially different electoral compositions. The change also altered which congressional offices residents depended on for constituent services. Reuters
Reuters reported that Nashville residents previously averaged approximately nine miles to their congressional district office. Following redistricting and subsequent office arrangements, reported averages for residents in the city’s three districts were approximately 24, 25, and 47 miles. These are averages across different groups of residents, rather than proof that every individual trip became longer, but the difference is striking. Reuters investigation
Nashville: Average distance to a congressional district office
Miles, as reported by Reuters. The three post-redistricting figures refer to different districts.
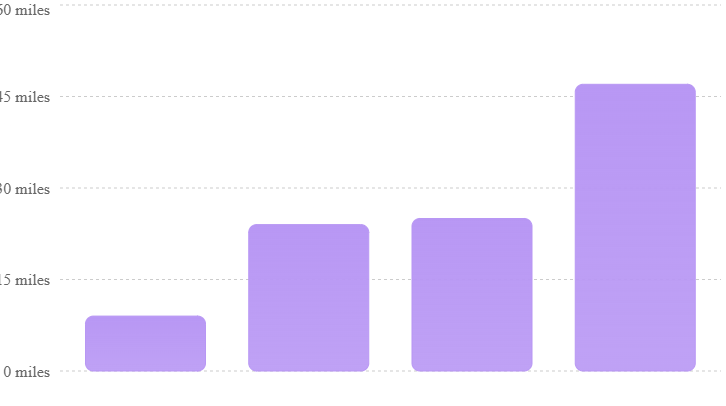
Source: Reuters, October 17, 2026.Rounded reported averages; distances do not represent individual journeys.
A district office isn’t a polling place, and distance alone doesn’t tell us whether constituents receive good service. People can call, email, or arrange appointments. Still, there’s something worth considering when a congressional boundary changes the practical geography of contacting your representative.
A map that appears to be a collection of colored shapes on a legislative computer screen can turn into a longer trip for somebody who needs help resolving a federal benefits problem.
That’s where this story becomes more interesting than another argument about which party gained a seat.
How the trick works. Congressional districts must satisfy population-equality requirements, but that still leaves mapmakers considerable discretion over where the boundaries go. Two familiar techniques are called packing and cracking, and neither requires changing a single ballot. Brennan Center: Gerrymandering explained
Packing concentrates voters who favor one party into relatively few districts, where they may win by overwhelming margins. Cracking distributes those voters among several districts, where they may lack enough support to elect their preferred candidates. Brennan Center
You can understand the effect with a simple hypothetical. Imagine 100 voters divided into five equally populated districts. Sixty favor Party A, and forty favor Party B. The statewide political preferences stay exactly the same, but the district arrangements change.
Same electorate, different district outcomes
Hypothetical example, not an actual election map.
3 A / 2 B seats 5 A / 0 B seats
Party A (60 voters)
Party B (40 voters)
Party A seats
3 / 5
Party B seats
2 / 5
Choose either arrangement to see how identical statewide voting preferences can produce different seat distributions. Actual maps must also comply with geographic, population, and legal constraints.
In the first arrangement, Party A wins three districts, and Party B wins two. In the second, Party A wins all five.
The voters haven’t changed their minds. The statewide division remains 60–40. What changes is how those voters are grouped.
Now, before we turn this into a claim that every state should produce congressional seats in exact proportion to its statewide vote, there’s an important complication. The United States generally elects House members from single-member districts. That system doesn’t guarantee proportional representation, and geographic clustering can produce lopsided seat totals even without deliberate manipulation. Brennan Center
Democratic voters are often concentrated in large urban areas, while Republican voters are more widely distributed across suburban and rural communities. That pattern varies by state, and it can produce political advantages or disadvantages even when district boundaries follow neutral geographic rules.
This is why a mismatch between vote share and seat share is a reason to investigate, rather than proof by itself that somebody cheated.
The more revealing questions concern how the map was constructed, what alternatives were available, and whether its boundaries can be explained by legitimate districting principles.
Subscribe to Off Script / Blind Spot. It’s free, or help fund the research and tools we use every day.
If you appreciate investigations that explain the machinery behind the headlines, there’s plenty more coming.
The people holding the pencil. Once you understand what district boundaries can accomplish, the obvious question becomes who gets to draw them.
In many states, the responsibility belongs to legislators, who may have a direct interest in which districts are competitive and which are politically secure. Other states use redistricting commissions, although the way those commissions are appointed and the independence they possess vary substantially. National Conference of State Legislatures: Redistricting commissions
Some systems place greater emphasis on compact districts, keeping counties and municipalities together, or protecting communities of interest. Others give political actors considerable discretion within federal and state legal requirements. NCSL: Redistricting criteria
And the technology available to those actors has changed dramatically. Modern mapping tools allow people drawing districts to compare alternative boundaries against detailed population data and past election results. They can test how moving a neighborhood from one district to another might affect the partisan balance.
That doesn’t mean every unusual-looking district is a gerrymander. Sometimes irregular boundaries reflect rivers, municipal borders, or requirements under the Voting Rights Act. A district that looks tidy on a map can still divide a community, while an awkward-looking district may preserve one.
Still, sophisticated mapping tools can be used to pursue partisan objectives with considerable precision.
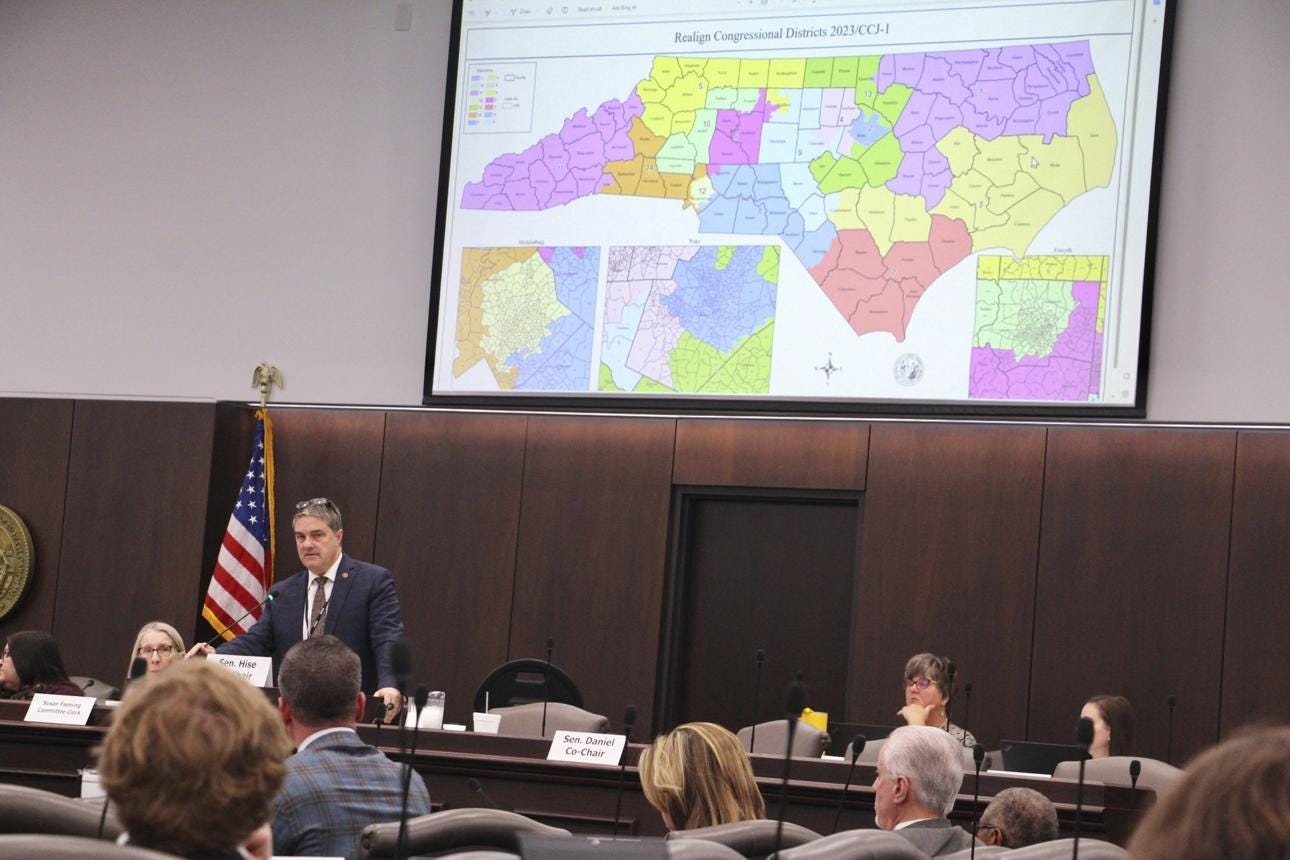
Redistricting decisions are made through state-specific political and administrative processes. The rules governing who draws the map differ substantially across states.
There is also an uncomfortable political reality here: Both major parties have incentives to protect their advantages when they control the process.
Republican-controlled states have drawn maps intended to improve Republican representation. Democratic-controlled states have done the same for Democrats. The circumstances and legal outcomes differ, and those differences matter, but the underlying temptation isn’t restricted to one party. Brennan Center
One argument often offered in defense of aggressive partisan redistricting is that unilateral restraint puts a party at a disadvantage if its opponents continue drawing favorable maps elsewhere.
It’s an argument worth taking seriously because the House is a national institution assembled from district elections in fifty separate states. A map drawn in one state can influence the national balance of power, even though voters in other states have no direct say over it.
But there’s a question buried inside that argument.
If each side justifies manipulating district boundaries because the other side is doing it, what incentive remains to develop rules that protect voters regardless of which party controls the legislature?
That isn’t a question with a convenient partisan answer.
The courts can only go so far. In 2019, the Supreme Court issued a decision that substantially changed the federal legal landscape for partisan gerrymandering.
In Rucho v. Common Cause, the Court held that claims of excessive partisan gerrymandering present political questions beyond the reach of federal courts. The majority concluded that federal judges lacked a judicially manageable constitutional standard for determining how much partisan advantage is too much. Supreme Court opinion, pp. 1–34
The dissent argued that courts could identify extreme partisan gerrymanders and that leaving such arrangements without a federal judicial remedy undermined representative democracy. Dissenting opinion, pp. 1–33
The decision didn’t make every congressional map immune from legal challenge. State courts can enforce state constitutional requirements, and federal courts still have responsibilities under federal constitutional protections and voting-rights statutes. Brennan Center: Case analysis
But it removed one important avenue for challenging district boundaries solely because of their partisan effects.
That leaves voters navigating a complicated legal landscape in which the reason a map was drawn, the evidence of its effects, and the particular legal claim can determine whether a challenge succeeds.
Race adds another layer of complexity. Federal law prohibits certain forms of racial vote dilution, while the Constitution also places limits on using race as the predominant factor in drawing districts.
In 2023, the Supreme Court’s decision in Allen v. Milligan upheld a Voting Rights Act challenge involving Alabama’s congressional map. The case illustrated circumstances in which district boundaries can unlawfully diminish minority voters’ opportunity to elect preferred candidates. Supreme Court opinion
Those principles have remained the subject of significant litigation, including the 2026 proceedings involving Louisiana’s congressional districts. Louisiana v. Callais, April 29, 2026
It’s tempting to reduce all of this to a simple rule: Politicians shouldn’t be allowed to choose their voters.
The difficulty is translating that principle into workable legal standards while respecting geography, communities, population equality, racial protections, and the constitutional responsibilities of state governments.
That difficulty doesn’t excuse deliberate manipulation. It explains why reform has proved so challenging.
But what would a fair map actually look like? This is the part of the discussion that tends to get lost when everyone starts counting potential Republican and Democratic seats.
Suppose a city votes overwhelmingly for one party. Should its residents be kept together in a district that reflects their shared political preferences, even if the resulting election is rarely competitive? Or should the city be divided among several districts to produce closer contests?
There isn’t a universal answer.
Keeping a community together may strengthen its collective voice. Dividing it can sometimes create additional opportunities for representation, depending on the surrounding population and the preferences of voters. But it can also weaken a politically cohesive community’s ability to elect candidates it supports.
A competitive district isn’t automatically fair, and a safe district isn’t automatically unfair.
The real question is whether the map reflects defensible principles applied consistently, or whether those principles were selectively invoked to achieve a desired political result.
One way to investigate is to compare an enacted map with thousands of alternative maps generated under the same legal and geographic constraints. Researchers can examine whether the enacted map produces an unusually strong partisan advantage relative to those alternatives. MGGG Redistricting Lab: Computational redistricting research
That kind of analysis doesn’t eliminate judgment or resolve every legal question, but it can reveal patterns that a casual glance at a colorful map would miss.
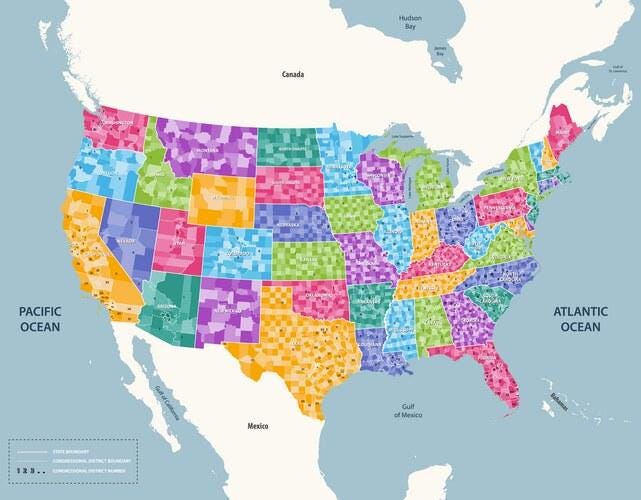
District maps are more than colorful boundaries. Their design determines which populations are grouped together for congressional representation.
And there’s something else we should remember.
The people who draw the maps don’t have to know exactly how every voter will behave in the future. Political preferences change. Candidates matter. Turnout fluctuates. Unexpected events can transform an apparently safe district into a competitive one.
A map can create an advantage without guaranteeing an outcome.
That distinction matters because redistricting is a powerful influence on elections, but it is never the only influence.
So what does this mean for November 3? With Election Day approaching, Americans are being inundated with arguments about candidates, campaign spending, advertisements, and polls. Those things matter, and Saturday’s Off Script examination of campaign fundraising raised legitimate questions about the resources available to different candidates and political organizations.
But fundraising happens within the political geography established by district boundaries.
A candidate running in a competitive district faces a different set of electoral circumstances from one running in a district where their party has an overwhelming advantage. Those differences can influence campaign strategy, advertising decisions, donor interest, and the kinds of issues candidates emphasize.
The map doesn’t write the campaign script, but it helps establish the stage on which the campaign takes place.
And for voters, the practical questions begin with understanding their own district.
The U.S. House’s representative lookup can help identify a current representative. For the district in which you’ll vote this November, particularly in states where boundaries have changed, consult your state election authority’s official map and ballot information.
Look at the shape of the district and the communities it contains. Find out who drew the boundaries and what criteria they were required to follow. If the map has been challenged, examine the arguments and the court’s decision rather than relying on a campaign advertisement’s summary.
You may discover that your district follows sensible community boundaries. You may discover that it combines places with surprisingly little in common. You may find that the lines have changed considerably since the previous election.
None of those observations alone proves wrongdoing. They do, however, give you a better understanding of the political structure in which your vote operates.
And that brings me back to those two voters we met at the beginning.
Both will cast legitimate ballots. Both deserve to have those ballots counted accurately. Both are entitled to representation, whether or not their preferred candidate wins.
What differs is the political environment surrounding their votes, including the composition of the districts in which they live.
For most of us, congressional boundaries are something we encounter only when a new map appears on the news or an election official tells us our district has changed.
Yet those boundaries can influence political representation for years, affecting which communities share a voice in Washington and how elected officials respond to competing local interests.
We spend an extraordinary amount of time scrutinizing the people asking for our votes. We examine their records, argue about their promises, and try to decide whether they deserve another term.
Maybe we should devote a little more attention to the people who decided which voters those candidates would have to persuade in the first place.
Because by the time we walk into the polling place, that decision has already been made.
If this was worth your time, hit Like, Restack or share it. That’s how independent work like this finds new readers.
[INSERT SHARE BUTTON]
THE BULLSHIT DETECTOR
Three claims worth checking before somebody passes them along as facts.
1. CLAIM: If an election worker writes anything on your ballot, your vote will be disqualified.
BULLSHIT — 💩💩💩💩
Social media posts are warning voters that a checkmark, initial, or other notation made by a poll worker can invalidate their ballot. Some even advise demanding a replacement if a worker makes any mark whatsoever. Associated Press fact-check
The problem is that election procedures vary by state, and certain administrative markings are perfectly legitimate. In Illinois, for example, election judges are required to initial ballots. Other jurisdictions use authorized markings to help manage different categories of ballots. PolitiFact, October 16
That doesn’t mean every conceivable mark is harmless. It means the sweeping claim is false.
If something looks wrong, ask an election official rather than relying on somebody’s cousin who supposedly heard something at poll-worker training.
The Associated Press investigated the claim, and PolitiFact independently examined the same misinformation. PolitiFact
2. CLAIM: The Supreme Court’s 2026 Louisiana redistricting decision means racial discrimination in congressional maps is now legal.
BULLSHIT — 💩💩💩💩
The Supreme Court’s April 29 decision in Louisiana v. Callais substantially restricted the circumstances under which race can be used to draw congressional districts. It held that Louisiana’s creation of an additional Black-majority district was not justified by Section 2 of the Voting Rights Act under the circumstances of that case. Supreme Court opinion, April 29, 2026
That is a consequential decision, but it did not repeal the Fourteenth or Fifteenth Amendments, abolish the Voting Rights Act, or declare racial discrimination lawful.
The majority and dissent disagreed sharply over the implications for minority voting rights. Those disagreements deserve serious attention, without turning the ruling into something it didn’t say. Majority, concurrence, and dissent
Read the Supreme Court’s decision.
3. CLAIM: The Supreme Court’s refusal to hear an election lawsuit proves the allegations in that lawsuit were true.
BULLSHIT — 💩💩💩💩
This is a recurring misunderstanding of how the Supreme Court operates.
When the justices decline to review a case, that generally leaves the lower court’s ruling in place. It does not mean the Court has endorsed every argument made by either side, and it certainly doesn’t establish the truth of allegations that were never proven. Supreme Court: Frequently asked questions
A refusal to hear an appeal is not a secret victory for whichever political personality happens to be celebrating it online.
Before accepting claims about what the Supreme Court supposedly decided, check whether it actually issued a ruling on the merits.
Elsewhere at Tom Hicks Media
Off Script / Blind Spot follows the political machinery, the money, and the decisions that deserve closer scrutiny. What The Hell? explores real events so ridiculous they sound like somebody invented them after several drinks, while Lotus Purrspective offers daily observations from a cat who has already decided that human civilization is a poorly managed experiment.
Chart Collision revisits the music, memories, and unexpected stories behind the hits. Rabbit Ears Classic TV looks behind the television shows we grew up watching, while The Backlot Ghost digs into the movies and backstage stories Hollywood left behind.
For sports fans, Panic Room Sports examines the games, the decisions, the fantasy headaches, and the occasional spectacle of people being paid extraordinary amounts of money to do something inexplicably stupid.
Buy Me a Cup of Tea
Research takes time, reliable information isn’t always easy to find, and independent journalism doesn’t come with a corporate expense account.
If you’d like to support Off Script / Blind Spot, consider buying me a cup of tea. It helps fund the research and tools we use every day.
One Question Before You Go
Would you rather have a congressional district that keeps your community together, even if one party almost always wins, or a more competitive district that combines communities with different political priorities?
I’m interested in how people weigh those two considerations, because they don’t always point toward the same map.

#BlindSpot #OffScript #Election2026 #Midterms2026 #Gerrymandering #Redistricting #VotingRights #Congress #IndependentJournalism